UV LED Irradiance Uniformity: How to Map Hot Spots Across the Curing Area

What Irradiance Uniformity Measures
Irradiance uniformity describes how much the intensity varies across the area a part actually passes through. It is usually expressed as a ratio between the highest and lowest reading inside the defined area, or as an allowed band around a nominal value, rather than as a single absolute figure. That distinction is why uniformity and dose are separate questions: irradiance versus dose explains how intensity and exposure time combine to deliver energy, while uniformity explains whether every part of the surface receives the same energy under the same conditions. In UV LED system design the two are specified separately for exactly that reason, because a uniformity figure says nothing about speed and a dose figure says nothing about distribution. A process can be built on a sound dose calculation and still fail in the field because one zone of the part sat in a cold band.

Which Parameters Matter Most for UV LED Irradiance Uniformity
Which parameters matter most for UV LED irradiance uniformity? Emitter spacing and array layout come first, because individual emitters always have a brighter center and a dimmer edge, and only overlap flattens that profile. Secondary optics matter next, since lenses and reflectors can either spread the beam to fill the gaps or concentrate it and make them worse. Working height belongs in the same discussion, because moving the head changes the overlap pattern before it changes the average intensity. Temperature and aging matter because emitters do not all run at the same die temperature in a large array, and output drifts with both. The measurement method closes the list, because a sensor that is too large, too small or held at the wrong height will report a uniformity value that the process does not actually see. The table below summarises those inputs.
| Parameter | Where It Comes From | Effect on Uniformity |
|---|---|---|
| Emitter spacing and layout | Array design and head geometry | Sets where hot spots and gaps appear across the area |
| Secondary optics | Lenses, reflectors, diffusers, protective windows | Flattens or concentrates the pattern from each emitter |
| Working height | Mechanical mounting above the substrate | Changes how much adjacent emitters overlap at the surface |
| Thermal behavior | Heatsinking, duty cycle, enclosure airflow | Introduces output differences between emitters in the same head |
| Emitter aging | Operating hours and drive conditions | Moves the pattern over time even when the design is unchanged |
| Sensor size and position | Instrument selection and measurement fixture | Determines whether the reported value represents the process |
How to Map Hot Spots Across the Curing Area
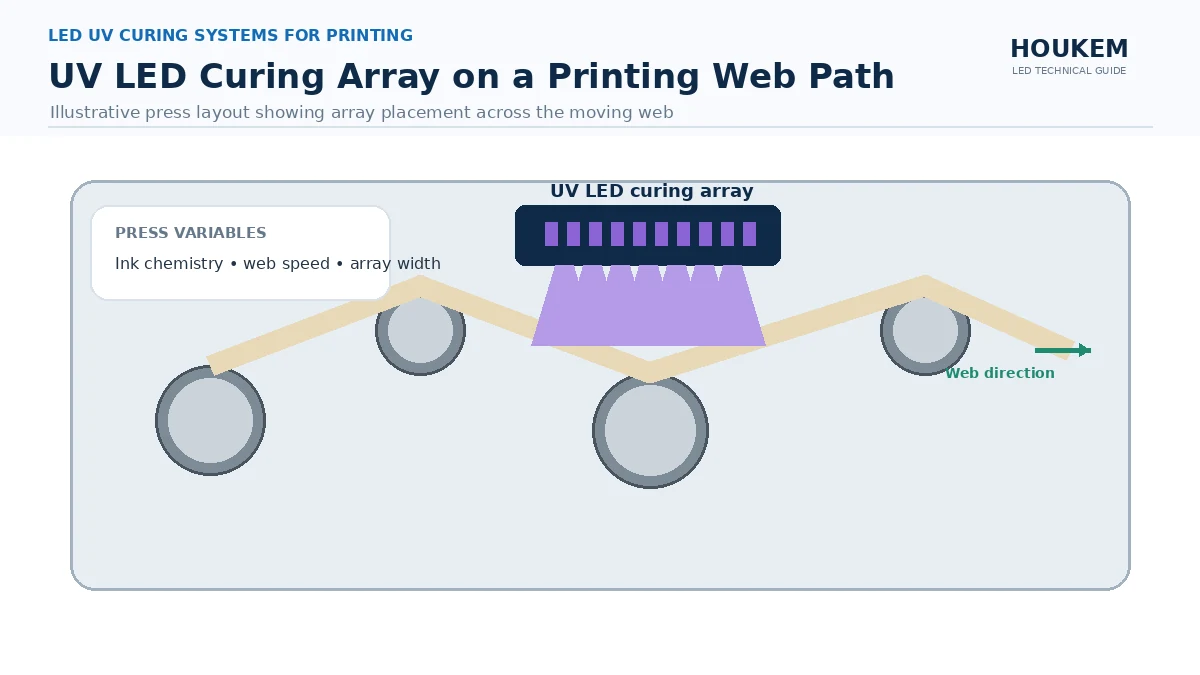
For UV process engineering, mapping is a straightforward procedure once the area and the pass criteria are defined. Mark the curing area, define a grid fine enough to catch a local hot spot rather than only a general trend, and step the sensor through the grid at production height and production speed. Record absolute readings rather than relative ones, then report the maximum, the minimum and their ratio, and plot the values so the shape of the distribution is visible. It is worth measuring the area slightly wider than the part, because edge fall-off often sits just outside the nominal footprint and becomes relevant as soon as the part position moves. Within UV Measurement & Validation, the mapping record is the evidence that a process window exists; measuring UV LED optical power covers the sensor and setup side of the same exercise, including the need to match the instrument to the wavelength band in use. Where the application involves a moving part rather than a static exposure, uniformity has to be mapped under the real scan conditions, which is why curing systems for printing treat line speed and head geometry as part of the same specification.

How Does UV LED Irradiance Uniformity Affect LED Performance
How does UV LED irradiance uniformity affect LED performance? It decides whether the weakest point on the part, not the average point, controls the process. If the low end of the range delivers only a fraction of the energy at the peak, the line speed has to be set for the cold zone, which means the rest of the part is over-exposed; the alternative is to accept under-cured product at the edges. Uniformity therefore shows up as a cost, a yield problem and a reliability variable at the same time. It also interacts with thermal design, because the emitters that run hottest in an array are usually the ones losing output first, and cooling high-power UV LEDs covers how the thermal path shapes that behavior.
How Should Engineers Validate UV LED Irradiance Uniformity Before Production
How to evaluate UV LED irradiance uniformity for an OEM design starts with a written acceptance band rather than a target value. Agree the area to be covered, the grid resolution, the measurement height, the instrument class and the allowed peak-to-minimum ratio, then map the head cold and again at thermal steady state, because output falls as the emitters warm and the pattern can shift with it. Repeat the map after any change that touches optics, array layout, drive current or cooling, and keep each map with its date so drift is visible. Then confirm the result under production conditions with the real part geometry and the real line speed, because a static map taken at the bench is only an estimate of what the moving part receives. That is how should engineers validate UV LED irradiance uniformity before production: as a dated, repeated map with agreed limits, not as one reading taken at the center of the beam. Array designs that use chip-on-board packaging need particular attention here, since IR COB LED packaging and its UV equivalents pack many emitters into a small area, which concentrates both the optical output and the heat that shapes it.
Frequently Asked Questions
Is uniformity a percentage or a ratio?
Both forms are used, and either is acceptable provided the definition is written down with the area it applies to. State whether the figure is the minimum divided by the maximum or an allowed variation around a nominal value.
How fine should the measurement grid be?
Fine enough to detect a local hot spot rather than only a general trend across the area. If two adjacent readings differ sharply, the grid is too coarse in that region.
Can uniformity be improved by increasing power?
Raising power lifts the whole profile and can narrow the relative gap between centre and edge, but it does not remove hot spots. It also moves the thermal balance, so the improvement has to be re-measured.
Should the head be mapped cold or warm?
Both, because the cold map shows the optical design and the warm map shows what production actually delivers. The acceptance decision should use the steady-state result.
Does uniformity change over the life of the array?
It can, because emitters age at slightly different rates and thermal conditions are not identical across a large head. Periodic re-mapping is what detects that drift before it reaches the product.
Bringing the Measurement Together
Uniformity is not a property of the emitter alone; it is the result of array layout, optics, working height, thermal behavior and the way the measurement is taken. Treating it as a specified and periodically re-checked process parameter is what keeps a curing window valid through tooling changes, seasonal temperature shifts and emitter aging. If you are specifying UV or IR LED sources for a curing, sensing or inspection system and want the optical and thermal parameters confirmed against a real project, send your requirements to HOUKEM and the engineering team will support the design-in.
UV LED Working Distance: How Distance Changes Irradiance at the Target