Multiplexed LED Display EMI: Scan Edges, Wiring and Driver Layout
This guide covers the parameters that determine how much energy is radiated, how layout and wiring change the outcome, and which measurements tell an engineer that a design is quiet before the product reaches an emissions test.
Quick Answer: Where the Emission Comes From
Emission scales with loop area and with the rate of change of current. A scan edge that switches several hundred milliamps in a few nanoseconds produces far more high-frequency content than the same current switched slowly.
Because a multiplexed panel already concentrates current into a small number of drivers, the scan architecture tends to create a small number of very fast, very large current steps rather than many small ones.
The practical consequence is that multiplexed LED display EMI is mostly a layout and drive problem rather than a component problem, and it is cheapest to solve at the board level rather than in the enclosure.
Governing Parameters: Edge Rate, Loop Area and Return Path
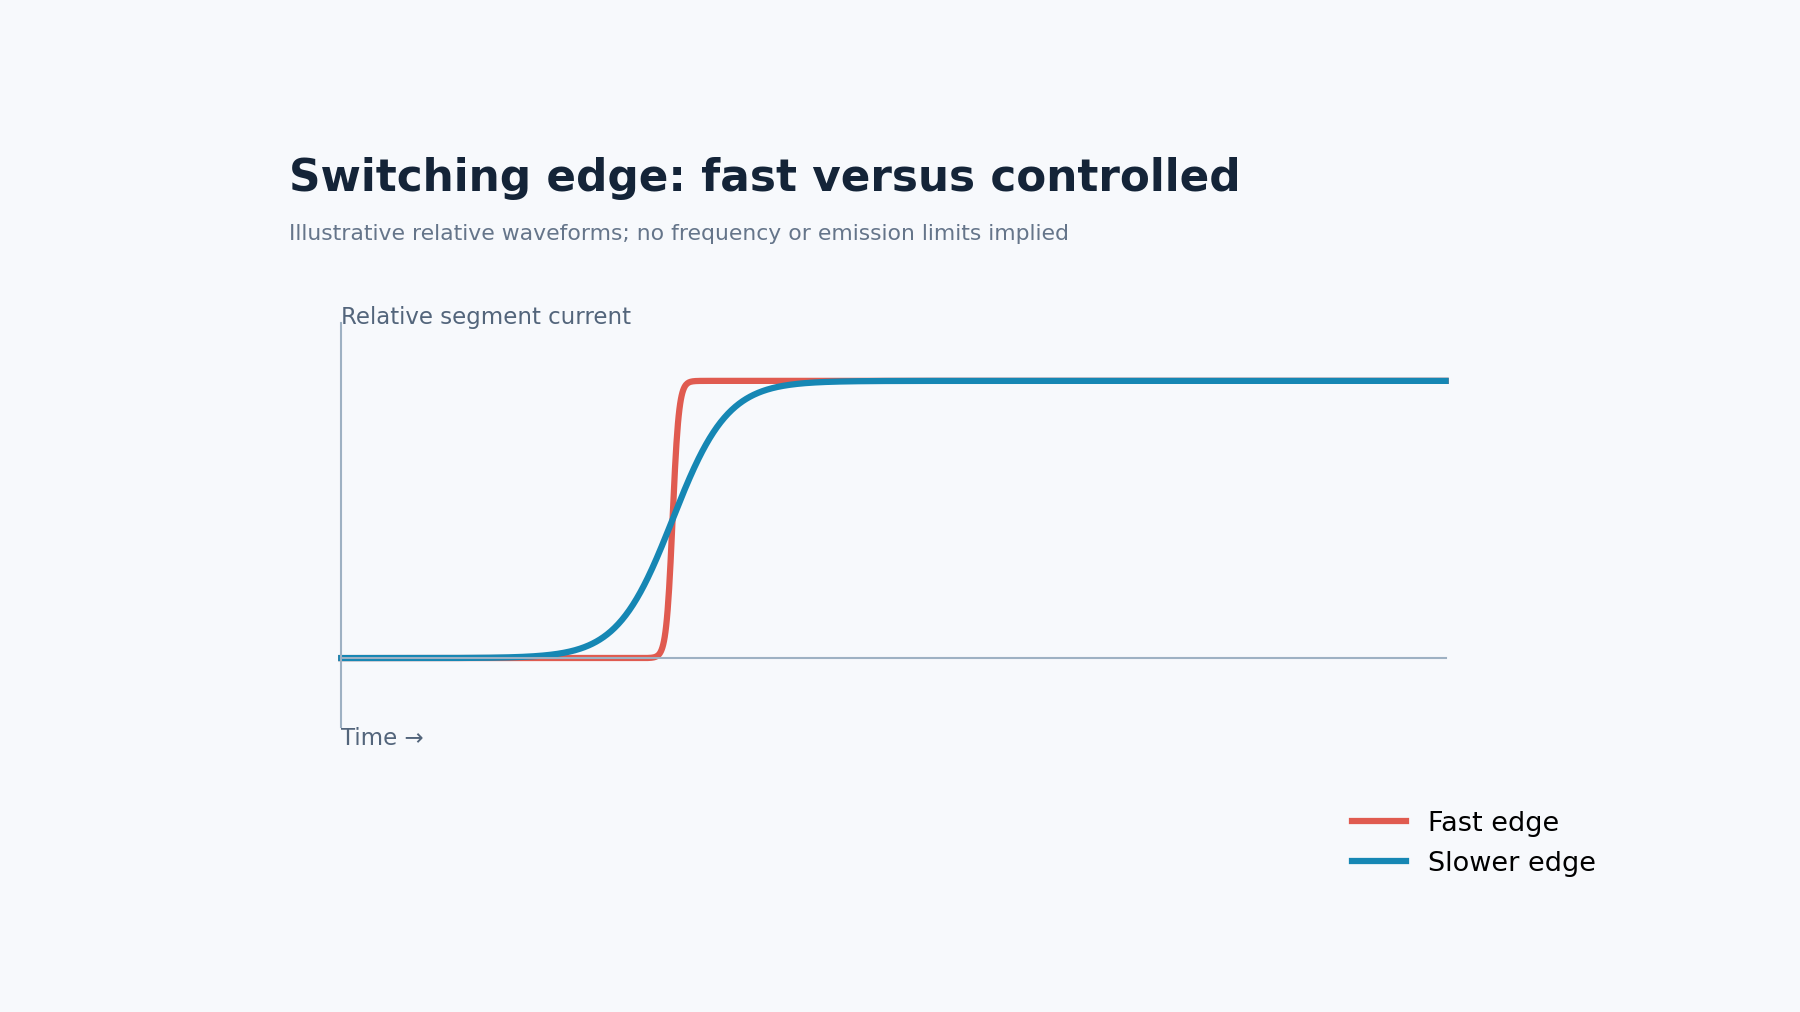
The first parameter is edge rate. The high-frequency spectrum of a switching event is set by how fast the current changes, so a driver with a slower controlled edge produces less high-frequency content than a hard-switched one. That is why driver selection and emission behaviour are linked.
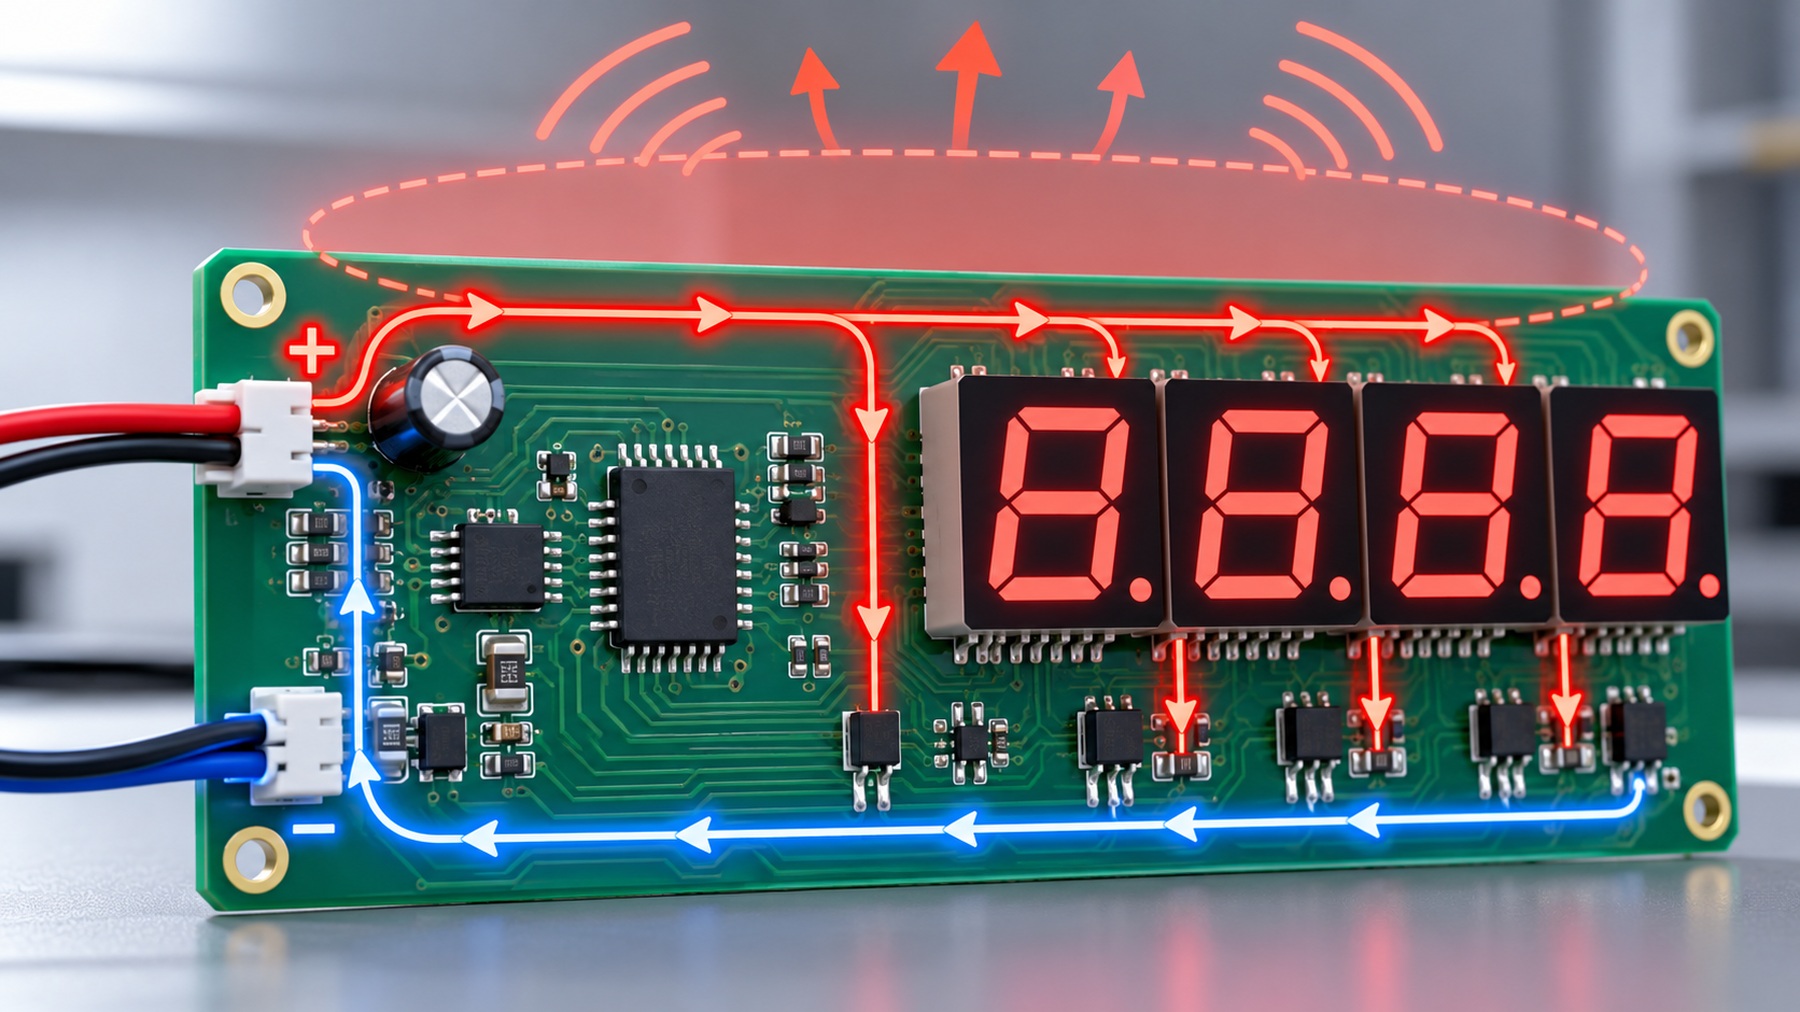
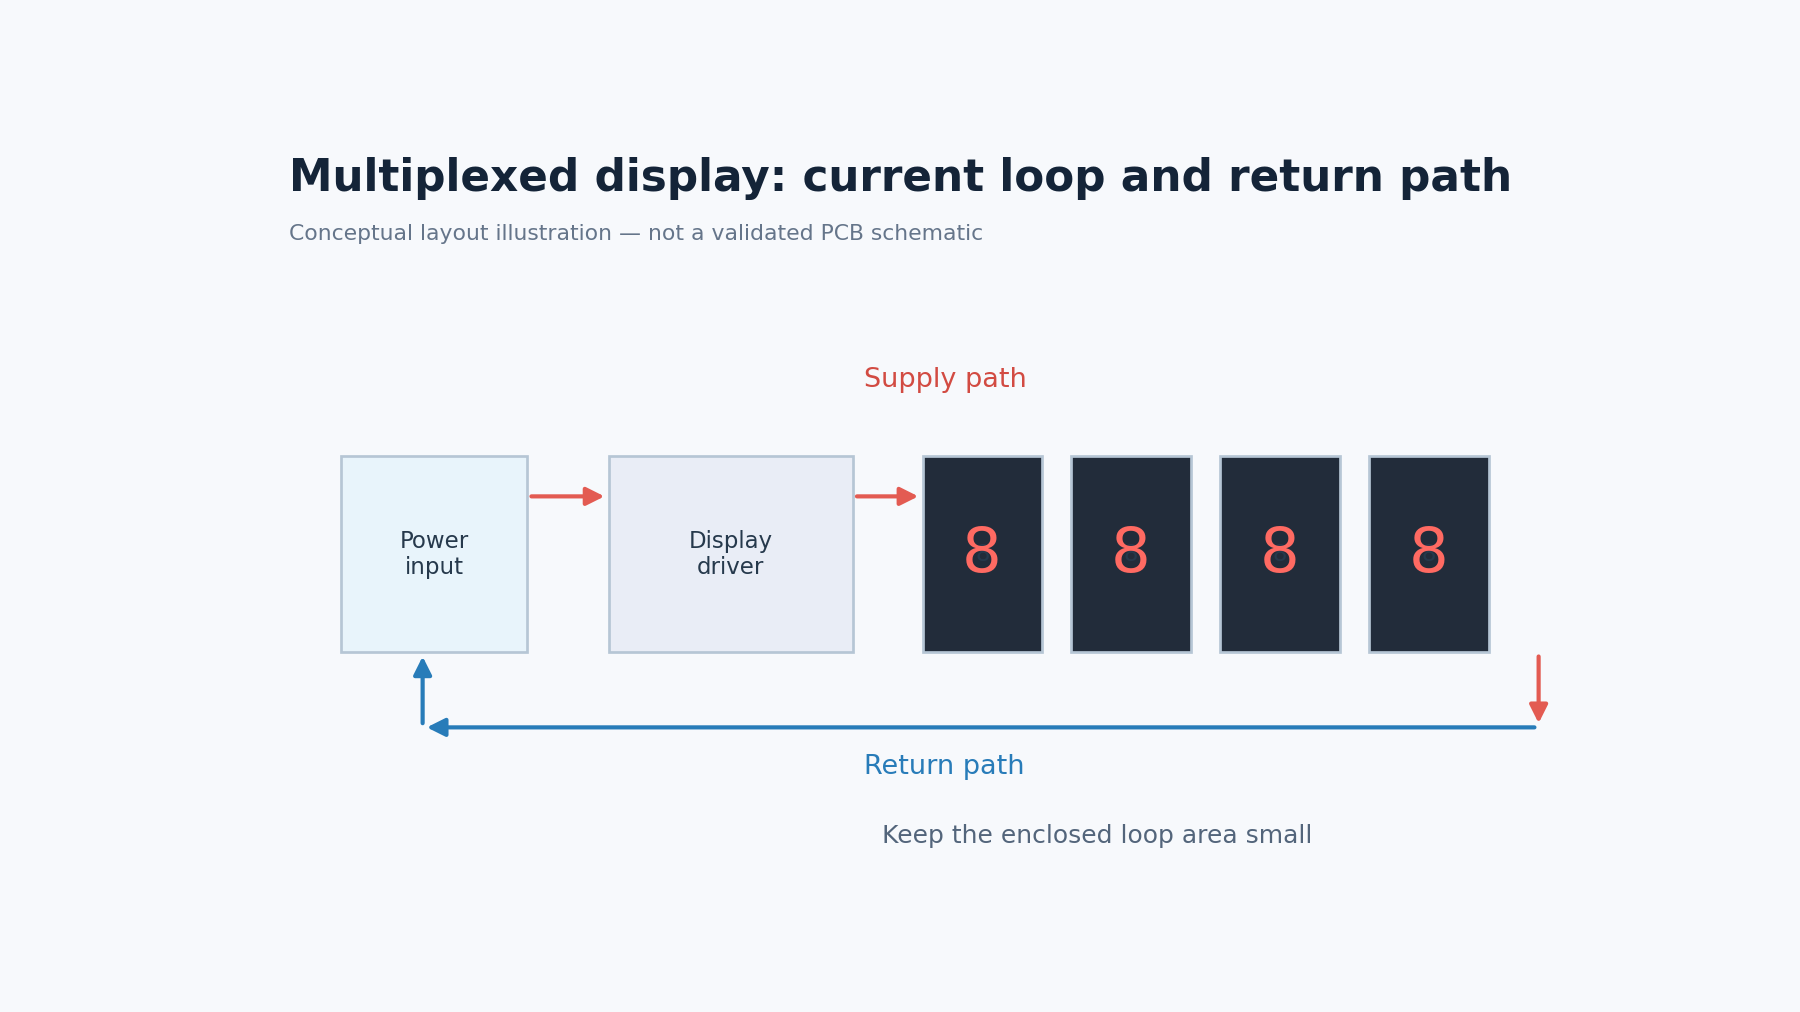
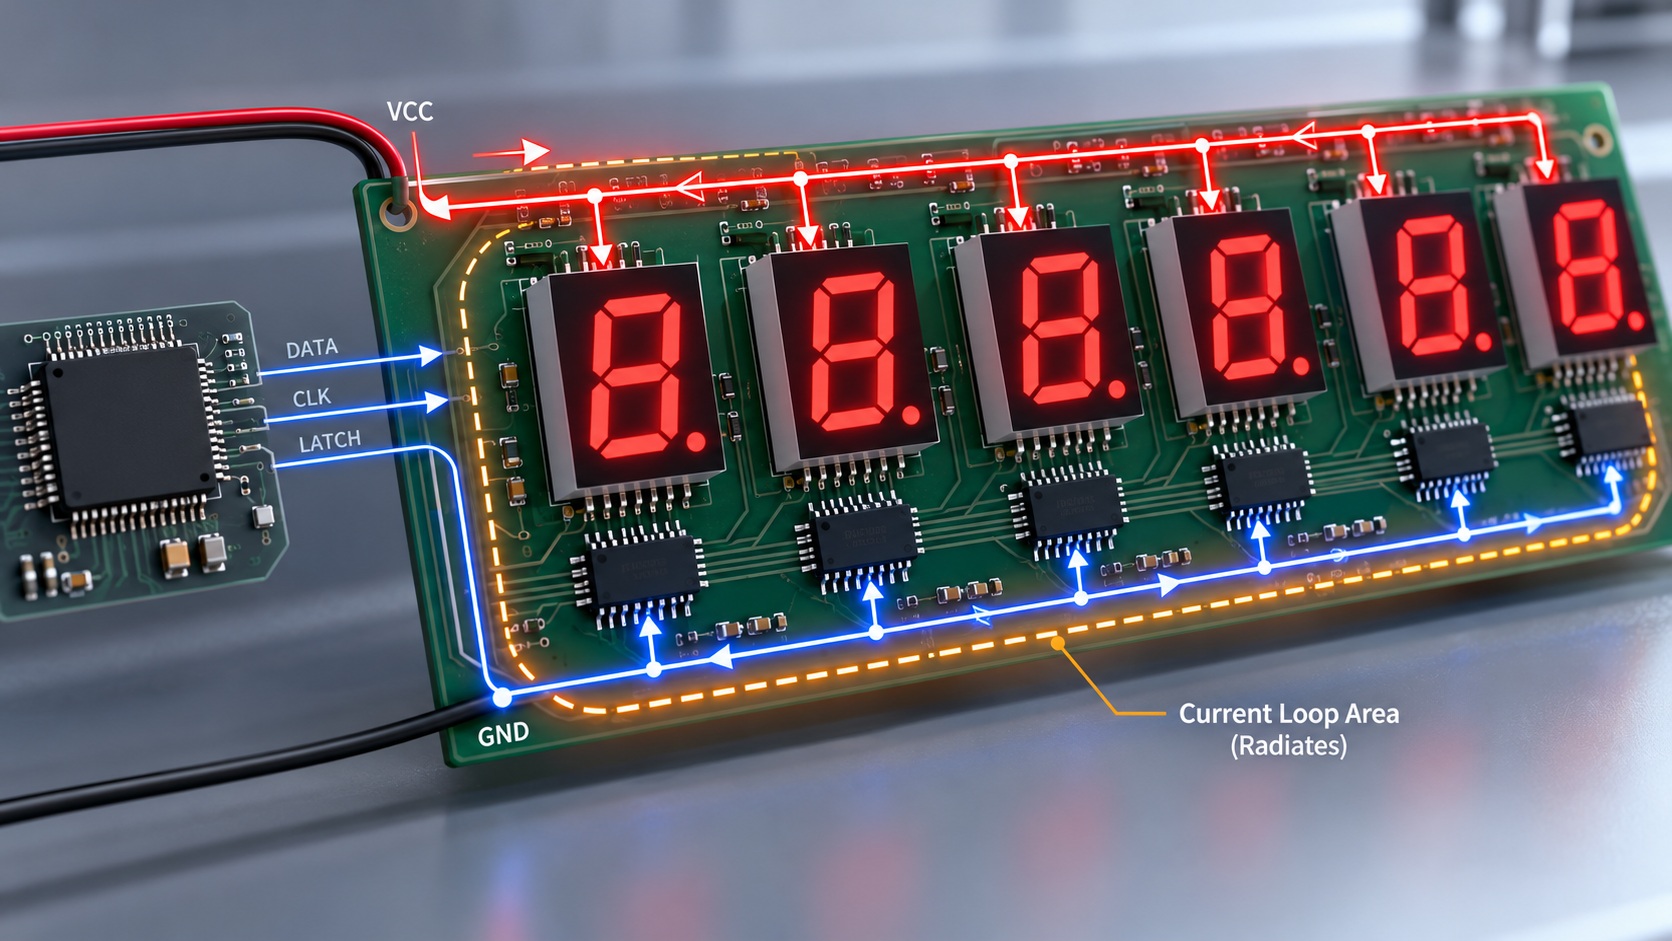
The second is loop area. Supply current leaves the source, travels to the switched load and returns, and the area enclosed by that round trip is the antenna. Keeping the return path directly beneath the supply trace shrinks the loop without changing the circuit.
The third is return path placement. A return that takes a convenient detour around the board edge enlarges the loop even when the schematic is unchanged, which is why emission problems so often appear after a layout revision rather than an electrical change.
| Parameter | Physical effect | Where it is controlled |
|---|---|---|
| Edge rate | High-frequency content of the scan pulse | Driver type and gate resistance |
| Loop area | Efficiency of the current path as an antenna | Trace and plane routing |
| Return path | Whether the loop stays small in practice | Ground plane continuity |
| Cable length and route | How far the loop extends beyond the board | Panel and harness design |
The comparison between switching device families belongs to this analysis, because the drive characteristic of the output stage sets the edge. our note on BJT versus MOSFET display drivers sets out how the two families behave at the switching edge.
Choosing the output stage therefore belongs to OEM LED display selection rather than to a separate component decision. The criteria in our guide to 7 segment display driver IC selection include the output behaviour that decides how abrupt the scan edge will be.
How to Reduce Emission in Practice
Start with the loop. Place the supply decoupling as close as possible to the driver, route the return directly under the supply path, and keep the plane continuous beneath the driver and the display connector.
Then treat the display cable as part of the circuit rather than as a passive connection. A long harness that carries the scanned current and its return in separate bundles forms a large loop outside the board, and no amount of on-board layout work compensates for it.
Only then consider slowing the edge. Reducing the switching speed costs some efficiency and increases switching loss in the driver, so it is normally applied after the geometric fixes rather than instead of them. The dimming method interacts with this choice, and our article on 7 segment display PWM dimming explains how the modulation scheme shapes the current waveform.
The circuit-level decisions follow from the panel size. Our guide to the large 7 segment display driver circuit shows how the drive arrangement changes as digit count and current grow, and those changes move the emission profile with them.
Trade-offs: Which Mitigation to Apply First
Layout changes are usually the cheapest mitigation because they cost engineering time rather than components, but they are only available before the board is released for tooling.
Edge-rate control costs efficiency and can affect brightness consistency if the drive waveform changes shape, so it needs to be evaluated against the optical requirement rather than in isolation.
Shielding and filtering are effective but add cost, mass and assembly steps, and they are best reserved for cases where the geometric fixes have been exhausted. Applying them first usually conceals a layout problem that will reappear in the next product revision.
The selection of drivers, dimming method and mechanical arrangement should be treated as one decision. This is the practical meaning of 7-Segment Drive & Circuit Design and of industrial LED display design more broadly: the electrical, optical and mechanical choices share the same constraints.
Verification and Specification Checklist
Before compliance testing, locate the emission source with a near-field probe and compare the board with the display connected and disconnected. A large difference points at the harness, while no difference points at the driver and its loop.
Then measure the scan current waveform at the driver and record the edge rate. If the edge has to be slowed to pass a limit, the change belongs in the specification with the efficiency consequence stated.
Repeat the measurement with the expected cable length and routing rather than on a short bench harness, because the harness is frequently the dominant contributor and the bench version understates it.
Finally, record the accepted layout and the accepted drive settings together. Emission results are only reproducible when the board revision, the cable route and the drive configuration are all known, and a change to any of them invalidates the earlier measurement.
Frequently Asked Questions
How to evaluate multiplexed LED display EMI for an OEM design?
Start from the current loop rather than the components: map where the scan current flows and returns, and measure how much area that path encloses. Then measure the edge rate at the driver and confirm the cable route does not extend the loop outside the board.
Which parameters matter most for multiplexed LED display EMI?
Edge rate and loop area matter most, because together they set how much high-frequency energy the scan pulses radiate. Return path placement and cable routing decide whether the loop stays small in the finished assembly.
How does multiplexed LED display EMI affect LED performance?
It rarely changes the optical output directly, because the emitter response is far slower than the interference. The visible effects usually appear elsewhere in the product, as disturbed sensing, audible noise in nearby circuits or a failed emissions test at system level.
How should engineers validate multiplexed LED display EMI before production?
Validate with a near-field probe to locate the dominant source, comparing the board with and without the display harness attached. Then confirm the fix with the production cable length and routing rather than a short bench harness.
Can a slower switching edge solve an emission problem on its own?
It can reduce high-frequency content, but it trades switching loss and may alter the brightness waveform. Treat edge control as one option alongside loop-area reduction and cable routing rather than as a universal fix.
Conclusion: Design the Loop, Not Just the Circuit
Multiplexed LED display EMI comes from the scan current loop and the speed at which it is switched. Loop area, return path and cable routing are decided on the drawing, which makes the layout the first place to look and the cheapest place to fix.
Measure the edge, shrink the loop, then confirm the result with the real harness attached. If you are developing a multiplexed panel for an industrial product and want the drive and wiring options reviewed, send your digit count and supply configuration to the HOUKEM team and we will confirm the applicable display scope.
LED Display Enclosure Window Alignment: A Mechanical Integration Guide
Shift Register 7 Segment Display Design: When One IC Simplifies MCU I/O