IR LED Polar Radiation Pattern: How to Read Angular Intensity Distribution
This guide explains how to read the curve, which parameters determine whether the pattern suits an application, and what to measure before the optical design is released.
Quick Answer: What the Curve Shows
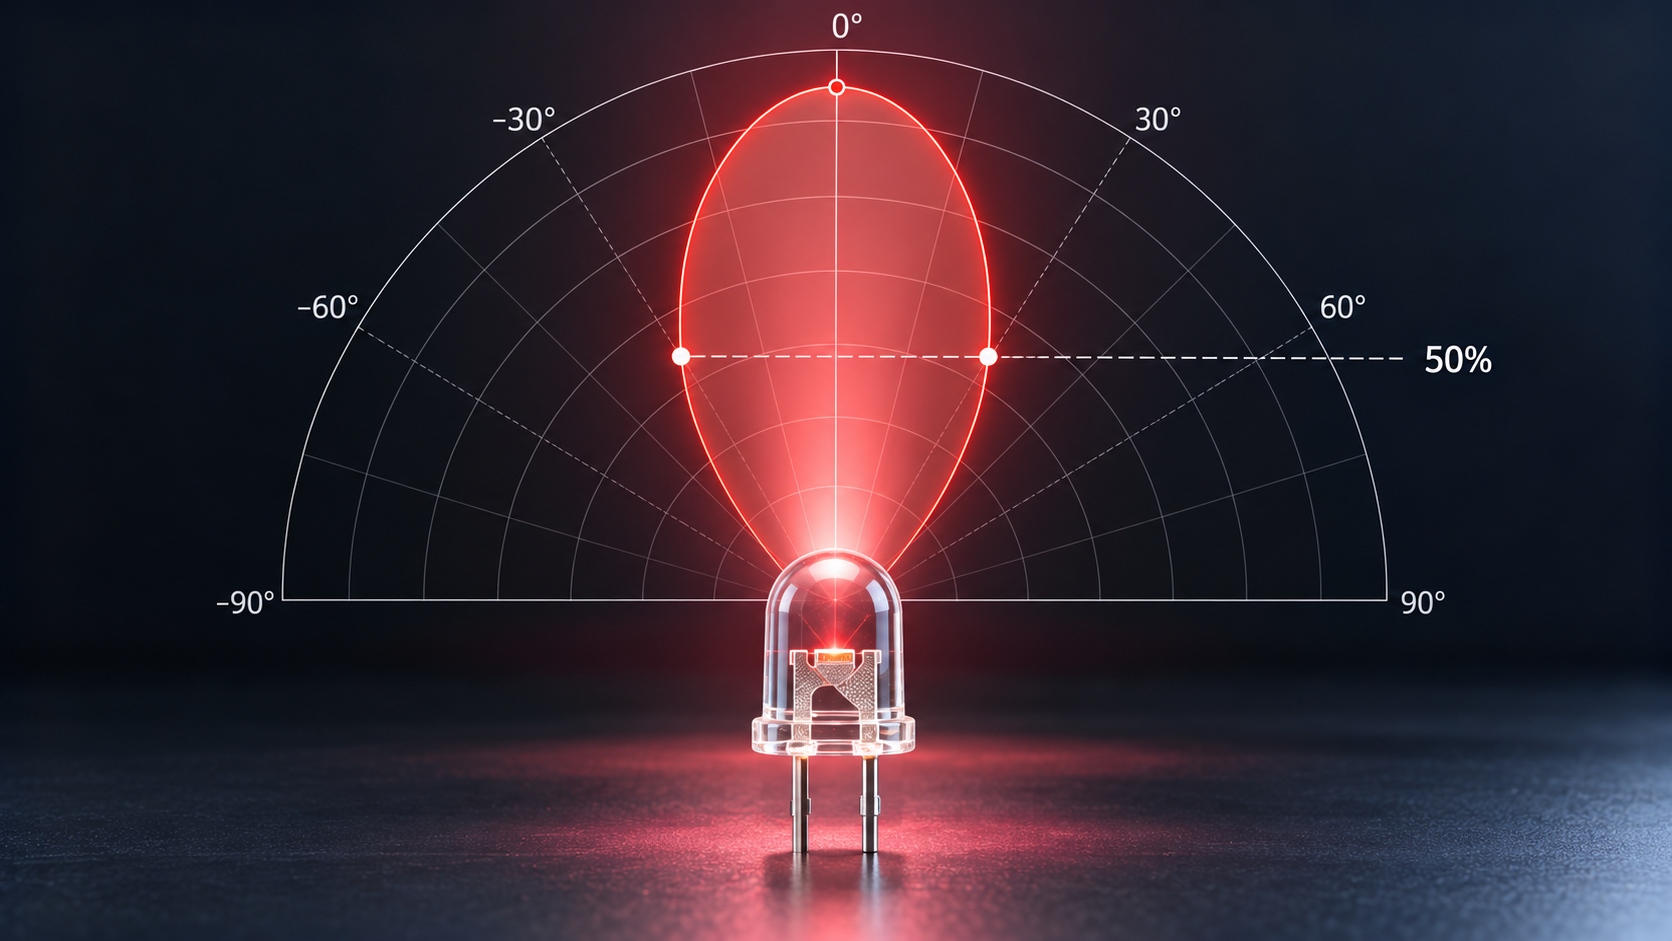
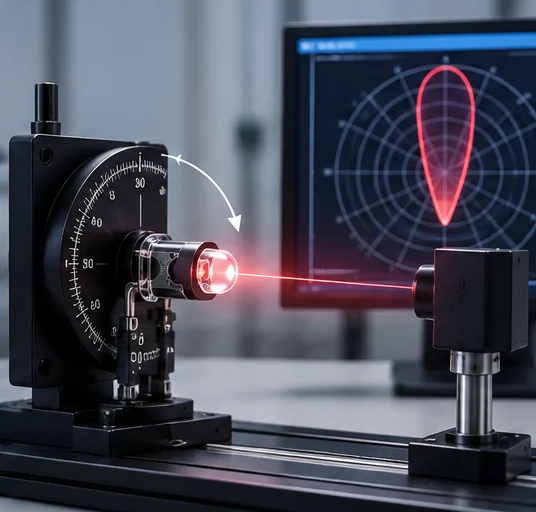
A polar plot places angle around the diagram and relative intensity along the radius. The point directly in front of the emitter sits at the centre of the reference direction, and the curve shows how quickly output falls away as the viewing angle increases.
The usual reference point is the half-intensity angle, often quoted as the viewing angle. It marks the angle at which intensity has fallen to half of its peak value, and it is a convenient summary of the width of the pattern.
The summary is convenient but incomplete. Two emitters with the same half-intensity angle can have quite different curves between the peak and the half-power point, and that shape is what determines how the emitter behaves in a real detection geometry.
Governing Parameters: Angle, Distance and Overlap
Intensity falls with angle, and irradiance at a surface falls with the square of distance. Both effects act together, so an emitter aimed slightly off axis loses more at the target than the pattern alone suggests.
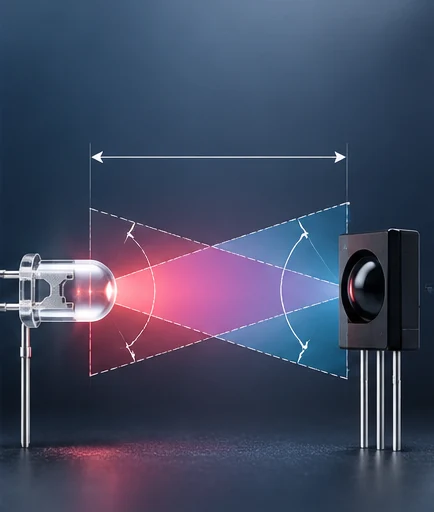
The detector adds a second angular limit through its field of view. Useful signal exists where the emission pattern and the detector field of view overlap, and the overlap shrinks quickly once either element is misaligned.
That is why the pattern curve should be read together with the mechanical layout rather than on its own. Our note on LED viewing angle versus beam angle explains how the two angle definitions differ, which matters when a datasheet and a mechanical drawing appear to disagree.
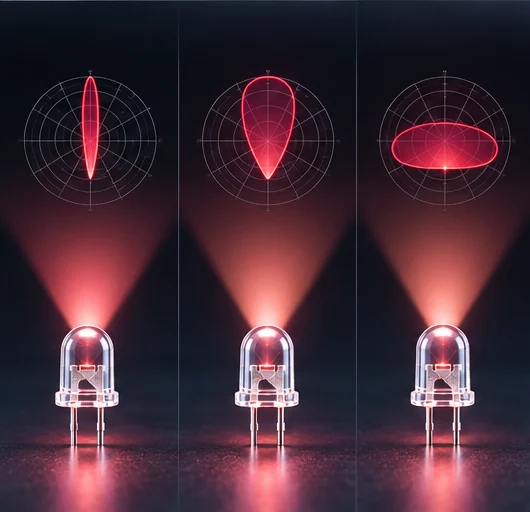
| Pattern width | Detection geometry it suits | Alignment tolerance |
|---|---|---|
| Narrow | Long separation with a small target | Low: small errors lose the link |
| Medium | General proximity and presence sensing | Moderate: workable mounting control |
| Wide | Short range with an uncertain target position | High: tolerant of mounting variation |
The distinction between the intensity measured in a direction and the total flux leaving the emitter is central to reading the plot correctly, and our article on IR LED radiant intensity explained sets out how the two quantities relate.
Read this way the pattern stops being a datasheet parameter and becomes a system input, because IR LED system design has to reconcile the emitted distribution with the detector and the mechanical envelope at the same time.
Matching the Pattern to the Detector
Begin with the geometry. Fix the separation between emitter and detector, then decide how much of the emitter output has to arrive for the detection threshold to be met.
That requirement defines a minimum acceptable intensity at the target, and the intensity in turn defines a maximum off-axis angle. The pattern curve converts that angle into a mounting tolerance, which is the number the mechanical design actually needs.
The wavelength choice interacts with the same decision, because detector responsivity varies with wavelength and therefore changes how much margin the system has. Our comparison of 940nm versus 980nm IR LED shows how the wavelength selection shifts the available signal.
Once the pattern and the detector are matched on paper, the arrangement should be checked against a real application. Our overview of IR LED applications shows the range of sensing layouts in which the same pattern question reappears.
Trade-offs: Range, Tolerance and Ambient Light
A narrow pattern concentrates output and extends usable range, but it reduces the mounting tolerance and makes the design sensitive to mechanical variation in production.
A wide pattern is more forgiving to assemble but spreads the same output over a larger angle, so the signal at any single point is lower and the design needs more drive or a more sensitive detector to compensate.
Ambient light adds a third consideration. A narrow field of view reduces the amount of background illumination the detector collects, so the pattern choice also affects how well the system rejects ambient conditions.
These three effects pull in different directions, and infrared emitter design is largely the business of choosing which one the application can afford to give up. That choice is the core of IR Optical Design & Detection as an engineering discipline.
Verification and Specification Checklist
Measure the pattern rather than accepting the datasheet curve, because mounting, windowing and nearby surfaces all modify the emitted distribution. A sweep in which the emitter is rotated in front of a fixed detector reproduces the curve under real conditions.
Record the half-intensity angle and, where the application is sensitive, the intensity at the working off-axis angle as well. The second figure is the one that predicts link margin in a production unit.
Then check the mechanical tolerance against that margin. If the permitted mounting error is smaller than the assembly process can hold, the fix belongs in the optical design rather than in an inspection step.
Finally, store the measured curve with the accepted configuration. A change of emitter, window material or lens invalidates the measurement, and the stored curve is what makes the next comparison possible.
Frequently Asked Questions
How to evaluate IR LED polar radiation pattern for an OEM design?
Fix the emitter-to-detector separation and the minimum signal the detection circuit needs, then convert that requirement into a maximum off-axis angle using the pattern curve. The resulting angle is the mounting tolerance the mechanical design has to hold.
Which parameters matter most for IR LED polar radiation pattern?
The half-intensity angle and the shape of the curve between the peak and that point matter most, because they decide angle tolerance and usable range. The detector field of view sets the second limit that the pattern must overlap.
How does IR LED polar radiation pattern affect LED performance?
It determines how much of the emitted output reaches the detector at a given separation and misalignment. A pattern that matches the detection geometry produces a stable link, while a mismatched pattern produces a system that works only when alignment is perfect.
How should engineers validate IR LED polar radiation pattern before production?
Validate by sweeping the emitter in front of a detector at the intended separation and recording intensity against angle. Compare the measured curve with the datasheet and check the intensity at the worst-case mounting angle.
Does a wider radiation pattern always give a more reliable detection link?
No, because the same output spread over a wider angle reduces the intensity at any single point. A wider pattern improves alignment tolerance while reducing margin, so the choice depends on which of the two the application can less afford to lose.
Conclusion: Read the Curve Before Choosing the Emitter
The IR LED polar radiation pattern converts an optical specification into a mechanical tolerance. Reading intensity against angle shows how much signal reaches the detector, and the shape of the curve between peak and half-power decides how much misalignment the design can survive.
Measure the pattern in the real mounting, record the intensity at the working off-axis angle, and keep the curve beside the accepted configuration. If you need the radiation pattern reviewed for a specific separation and detector, send your sensing geometry to the HOUKEM team and we will confirm the applicable emitter scope.
UV LED Power Supply Sizing: Current, Voltage Budget and Headroom
UV LED Optical Material Compatibility: Lenses, Windows and Adhesives