7 Segment Driver IC Thermal Dissipation: Estimating the Heat Inside the Chip
Quick Answer: Average the Current, Then Apply the Package
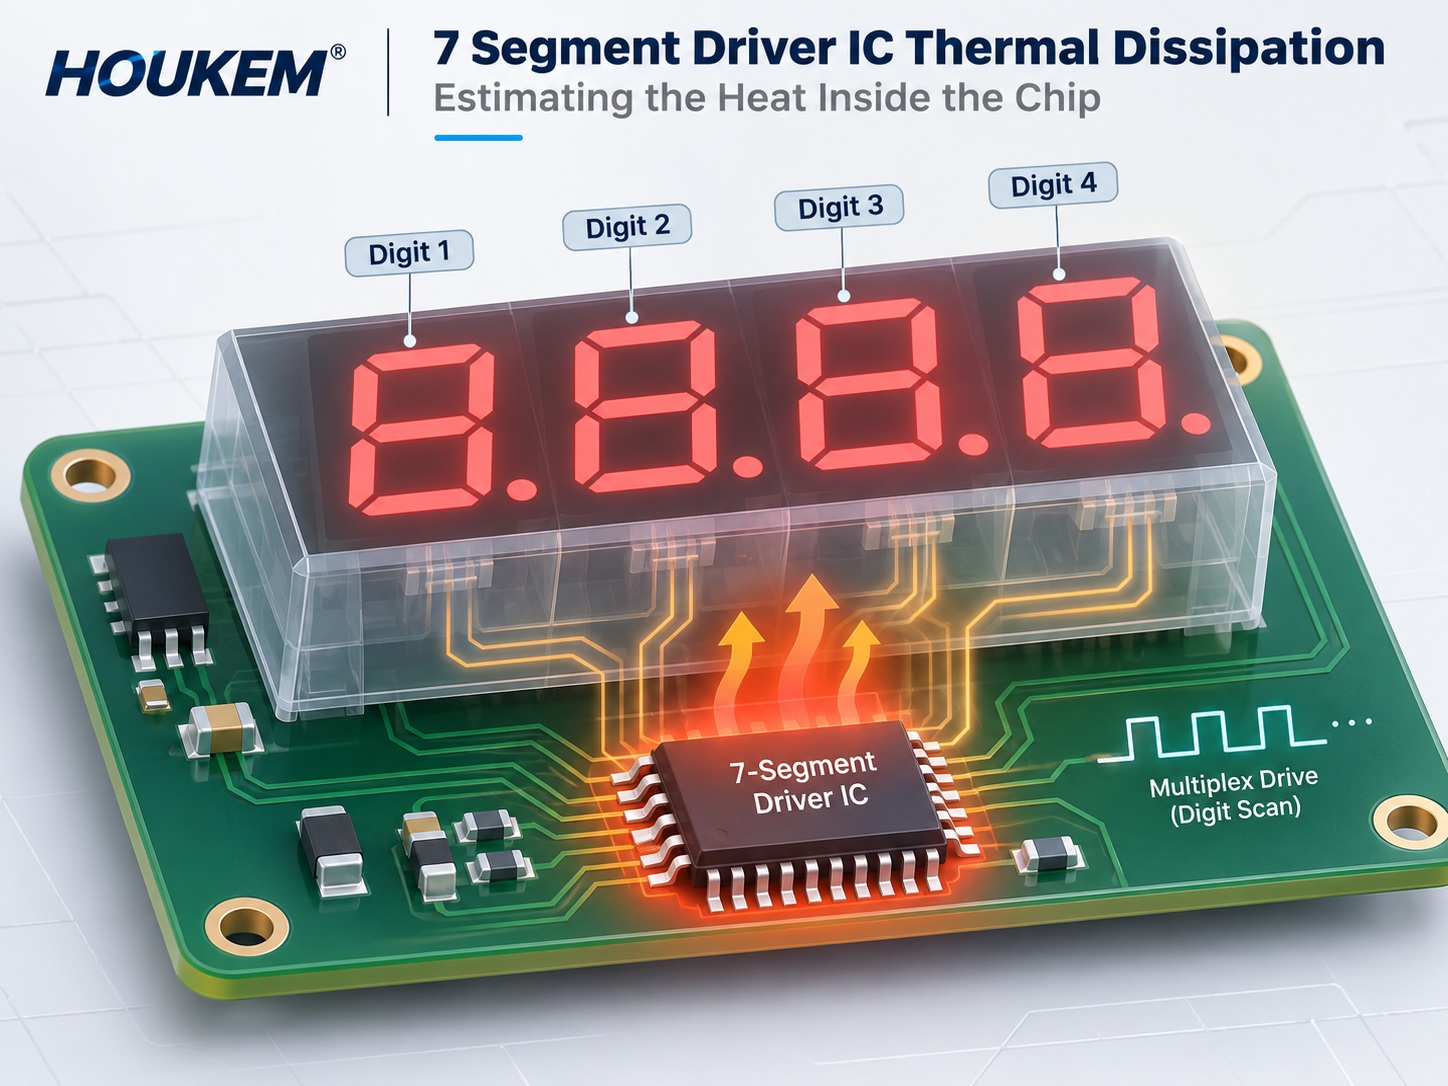
Dissipation in a multiplexed driver is roughly the channel voltage drop multiplied by the current, averaged over the scan period, plus switching and quiescent terms. Junction temperature then follows from a package thermal resistance and the surrounding board temperature, and the LED driver IC temperature you can measure on the package is always lower than the junction that matters inside it. The two numbers that change the answer most are the drop across the output stage at peak current and the duty cycle the scan actually uses.
Where the Heat Comes From
Every output that conducts sheds the difference between its supply and the voltage appearing across the LED plus its series element. At peak current that product can reach a substantial fraction of a watt per channel, and with several segments lit at once the instantaneous total is high even though the average is modest. The scan spreads that heat over time, and the package spreads it over the board, but neither removes it.
Because the loss depends on the voltage the output must drop rather than on the LED current alone, a display running from a higher rail dissipates more in the driver for the same brightness. That is the same trade-off described for a large 7 segment display driver circuit, where segment voltage rises and the driver absorbs the difference.
Averaging Over the Scan Duty
In a multiplexed design each digit conducts for one slot per scan period. If the scan is uniform, the average dissipation is the instantaneous channel loss multiplied by the number of segments lit in the worst digit divided by the number of digits, plus the loss in the common path while that digit is active. A digit showing an eight costs more than a digit showing a one, and a display alternating between them will settle at an average that changes with the data, so the 7 segment driver power dissipation figure is always a function of what is on screen rather than a constant of the circuit.
Uniformity is an assumption, not a guarantee. Firmware that holds a static screen, or a product that normally shows a dense alarm state, can hold the worst pattern for a long time. Budget for the pattern the product will actually display most, then check the worst pattern against the junction limit.
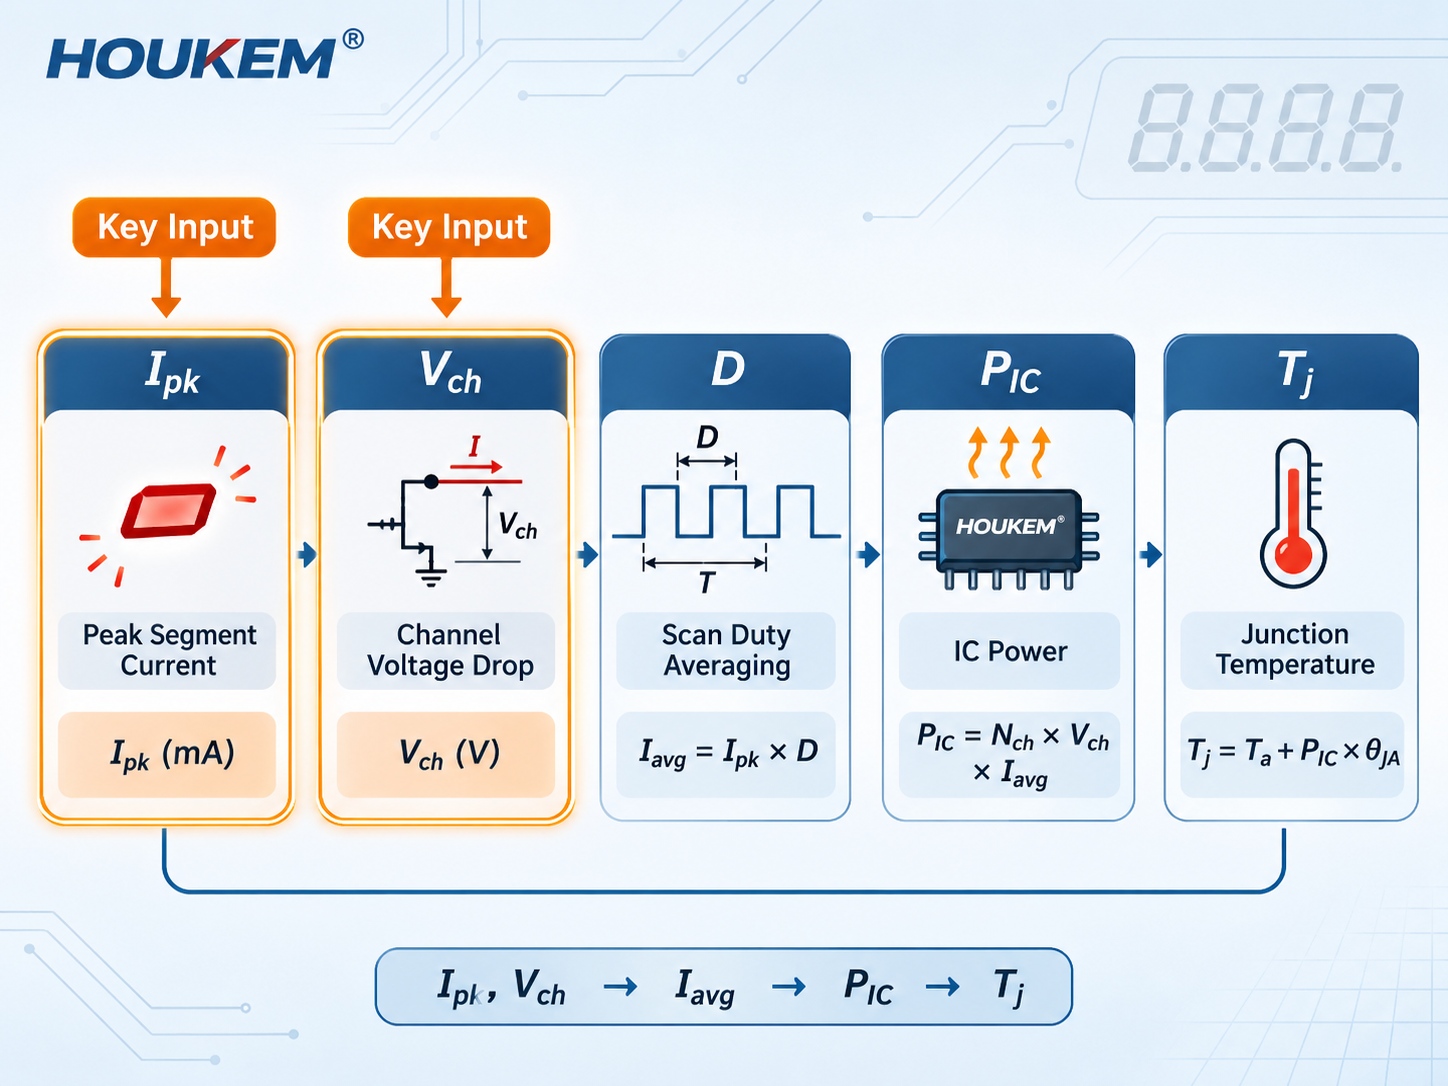
Building the Estimate in Five Steps
- Read the peak segment current from the design, not from the LED rating.
- Measure or estimate the output drop at that current; use the datasheet curve where one exists.
- Multiply drop by current for one channel, then add any loss in the common return path.
- Average over the scan duty for the chosen digit pattern, including the quiescent and switching terms.
- Convert total power to a junction temperature using the package thermal resistance and the local board temperature.
The arithmetic is simple; the difficulty is choosing defensible inputs. When a datasheet provides an output saturation curve, read it at the design current rather than assuming a constant drop, since the drop rises steeply at higher currents and flattens at low ones.
Reading the Package Thermal Path
A driver IC's heat leaves through the leadframe or the exposed pad into the copper beneath it, then into the board and finally the air. The junction-to-ambient figure on the datasheet is a property of a reference board, so it is a starting point rather than a prediction for your layout. The distinction between the two common thermal resistance definitions is set out in the guide to LED thermal resistance RθJA versus RθJC, and the same reading discipline applies to any packaged semiconductor.
Copper area under the device, thermal vias and the proximity of other heat sources decide how close the real board comes to the reference. In a dense display module the driver often sits next to the digits it drives, so the air around it is warmer than the room and the local reference temperature should be measured rather than assumed.
Comparing Package Options for the Same Load
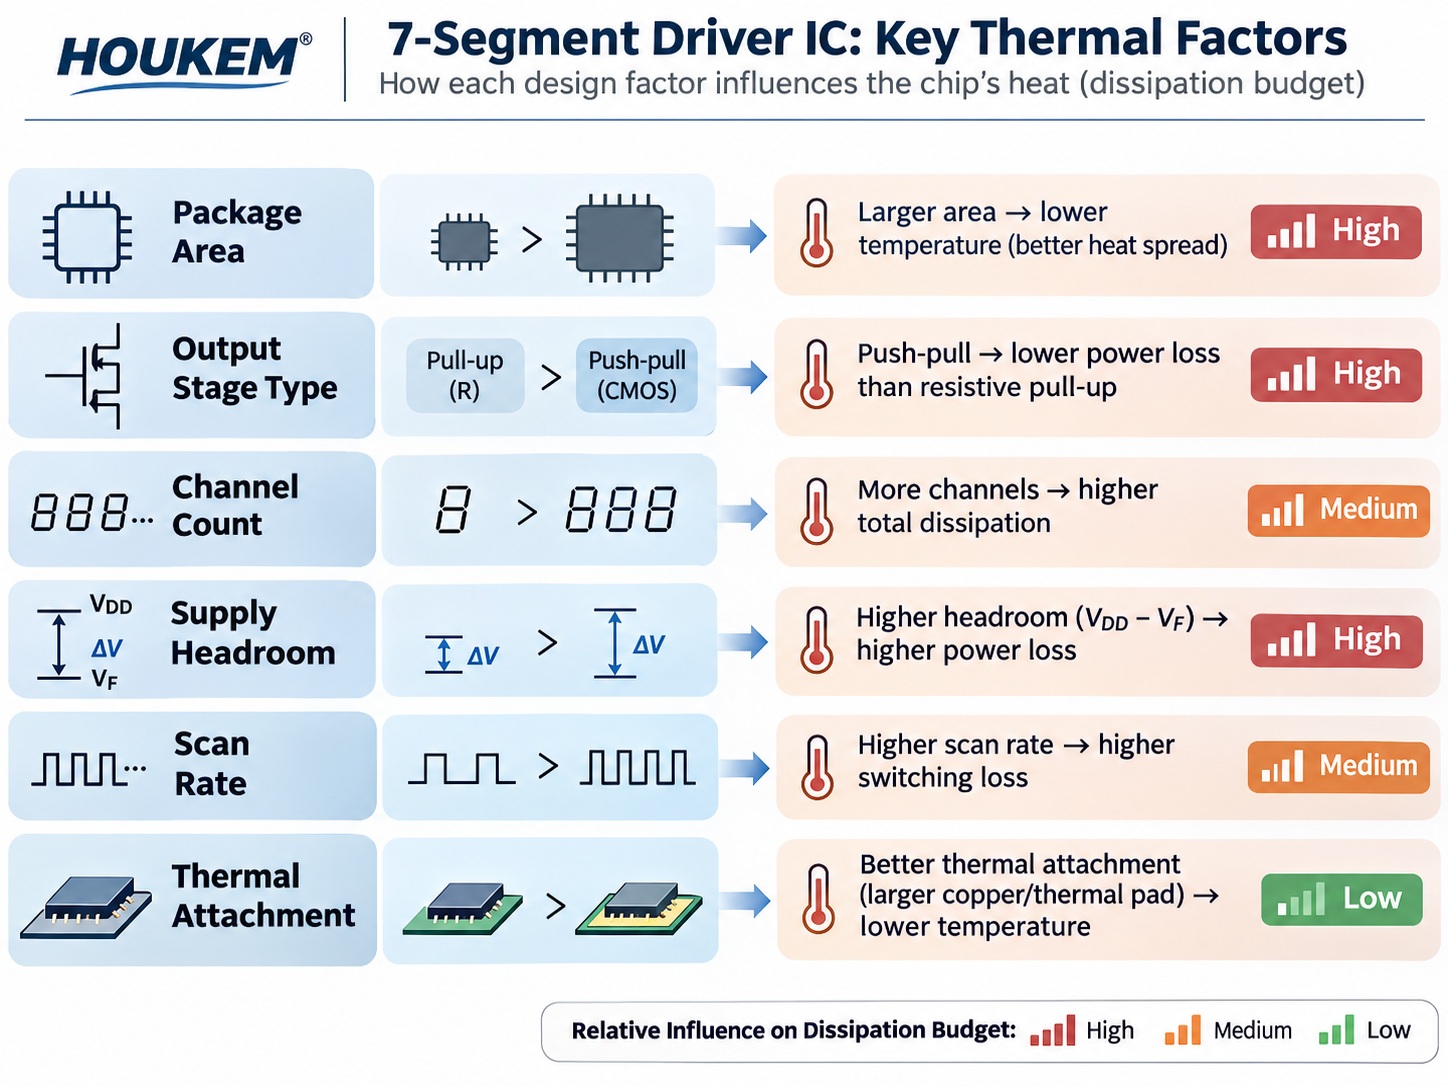
| Criterion | What to compare | Effect on the thermal budget |
|---|---|---|
| Package area and exposed pad | Pad size and how much copper can be attached underneath | Larger thermal attachment lowers the effective junction-to-board resistance |
| Output stage type | Whether the output behaves as a constant-current sink or a switch with an external resistor | An external resistor moves part of the loss off the chip at the cost of board area |
| Channel count against digits | Whether one device serves all digits or a chain of devices shares the load | Splitting channels divides the dissipation between packages |
| Supply headroom | Difference between the rail and the LED string voltage | Extra headroom is dissipated in the driver, so a tighter rail reduces heat |
| Scan rate | Higher refresh, shorter slots, same average | Average is unchanged, but switching losses rise with frequency |
Validating on the Bench
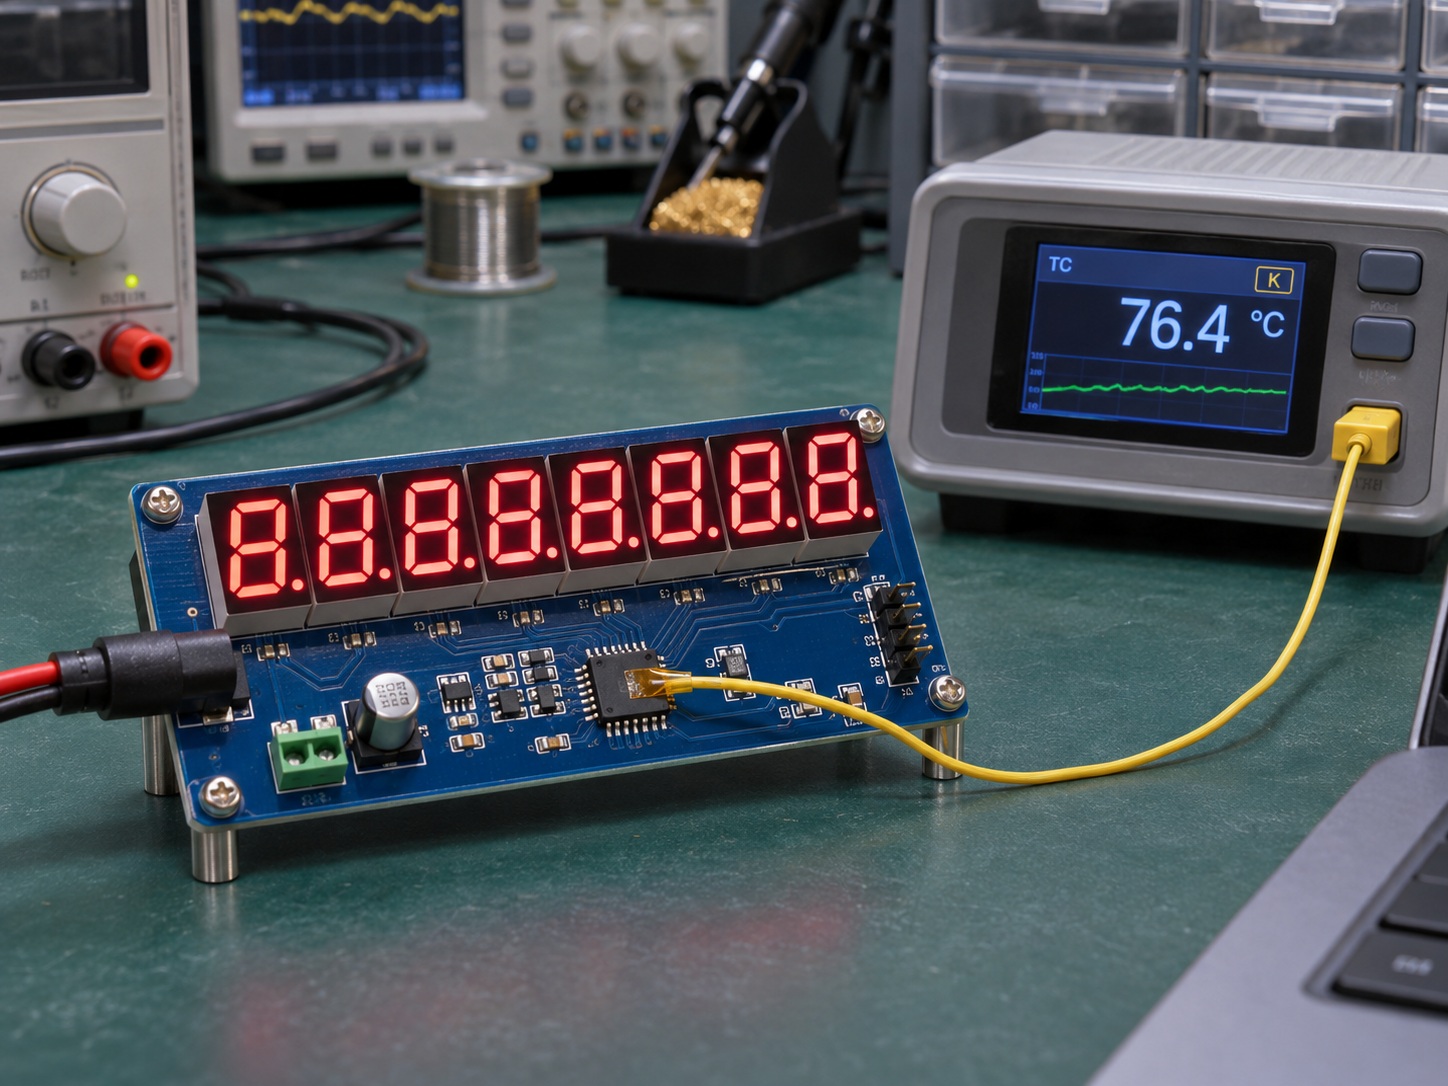
Two measurements settle most disputes. First, measure the supply current while the product displays the worst digit pattern, which gives the total input power and lets you subtract the LED optical and series-resistor share. Second, measure the package temperature with a fine thermocouple on the exposed pad or the specified reference point, then work back through the thermal resistance to the junction. If the calculated junction temperature sits within a sensible margin of the datasheet maximum, the design is defensible.
Repeat the measurement in the enclosure at the highest ambient the product will see. A driver that passes on an open bench often fails behind a tinted window, because the enclosure raises the local air temperature and removes the convection the bench provided; the multiplex driver thermal behaviour you measured on the bench is therefore the optimistic case, not the shipping one.
Where the Driver Fits in the Overall Design
Driver dissipation is one part of the display's power account; the LED side of that account is covered in the guide to 7 segment display current consumption calculation, which separates peak from average in the same way. The device choice itself, including polarity and interface constraints, is set out in the 7 segment display driver IC selection guide, and the external switch used when the current exceeds the IC output is compared in the BJT versus MOSFET 7 segment display driver analysis. When the driver and the LEDs share a board, the junction-temperature calculation method described in the LED junction temperature guide applies to both.
Frequently Asked Questions
How do I calculate 7 segment driver IC power dissipation?
Multiply the output voltage drop by the segment current for each conducting channel, add any common-path loss, then average over the scan duty for the worst digit pattern. Add the quiescent and switching terms before converting to temperature.
Why does the driver IC run hot when each LED is within its rating?
The LED rating constrains the current through the emitter, not the voltage the driver must absorb. A rail that sits well above the LED string voltage turns the surplus into heat inside the driver package.
Which digit pattern should be treated as the worst case?
The pattern that lights the most segments in the digit with the highest peak current, held for as long as the product will realistically display it. Static alarm states and all-eights test screens are common culprits, so the multiplexed LED driver overheating report usually names one of them.
Does a higher scan rate reduce driver heating?
No, because a faster scan shortens each slot but repeats it more often, leaving the average nearly unchanged. Switching losses rise with frequency, so the total can increase slightly.
Can external resistors move heat off the driver IC?
Yes, a series resistor can absorb part of the surplus voltage instead of the output stage. The trade-off is board area, an extra component per channel and a small loss of current accuracy.
What margin should be left to the maximum junction temperature?
Leave enough margin that the worst-case ambient and the worst-case pattern together still sit below the limit with the thermal path you actually built. Treat the datasheet thermal resistance as a reference-board figure, not a guarantee.
Conclusion: Estimate, Then Measure the Pad
Driver thermal load is a voltage-drop problem multiplied by a duty factor, and the result is then shaped by the package and the board. Estimating it before layout prevents the situation where a correct optical and electrical design still needs a board revision because one small package cannot shed its share of the heat, and it turns the LED display driver thermal calculation from a late troubleshooting exercise into an input to the layout itself.
For multiplexed display projects, share the digit pattern, scan rate and rail voltage with the engineering team so the drive arrangement and the display construction can be reviewed together. To start that review, send your project requirements to the HOUKEM team.
Decimal Point Brightness Matching: Keeping Small Annunciators in Line With the Digits
Multiplexed LED Display Power Supply Transient: Decoupling and Rail Droop