


LED L70 Lumen Maintenance: How to Read Lifetime Data From a Datasheet

This guide explains how the figure is produced, which conditions it assumes, and how an OEM engineer should translate it into a design decision for a specific drive current and thermal path.
Quick Answer: What L70 Actually States
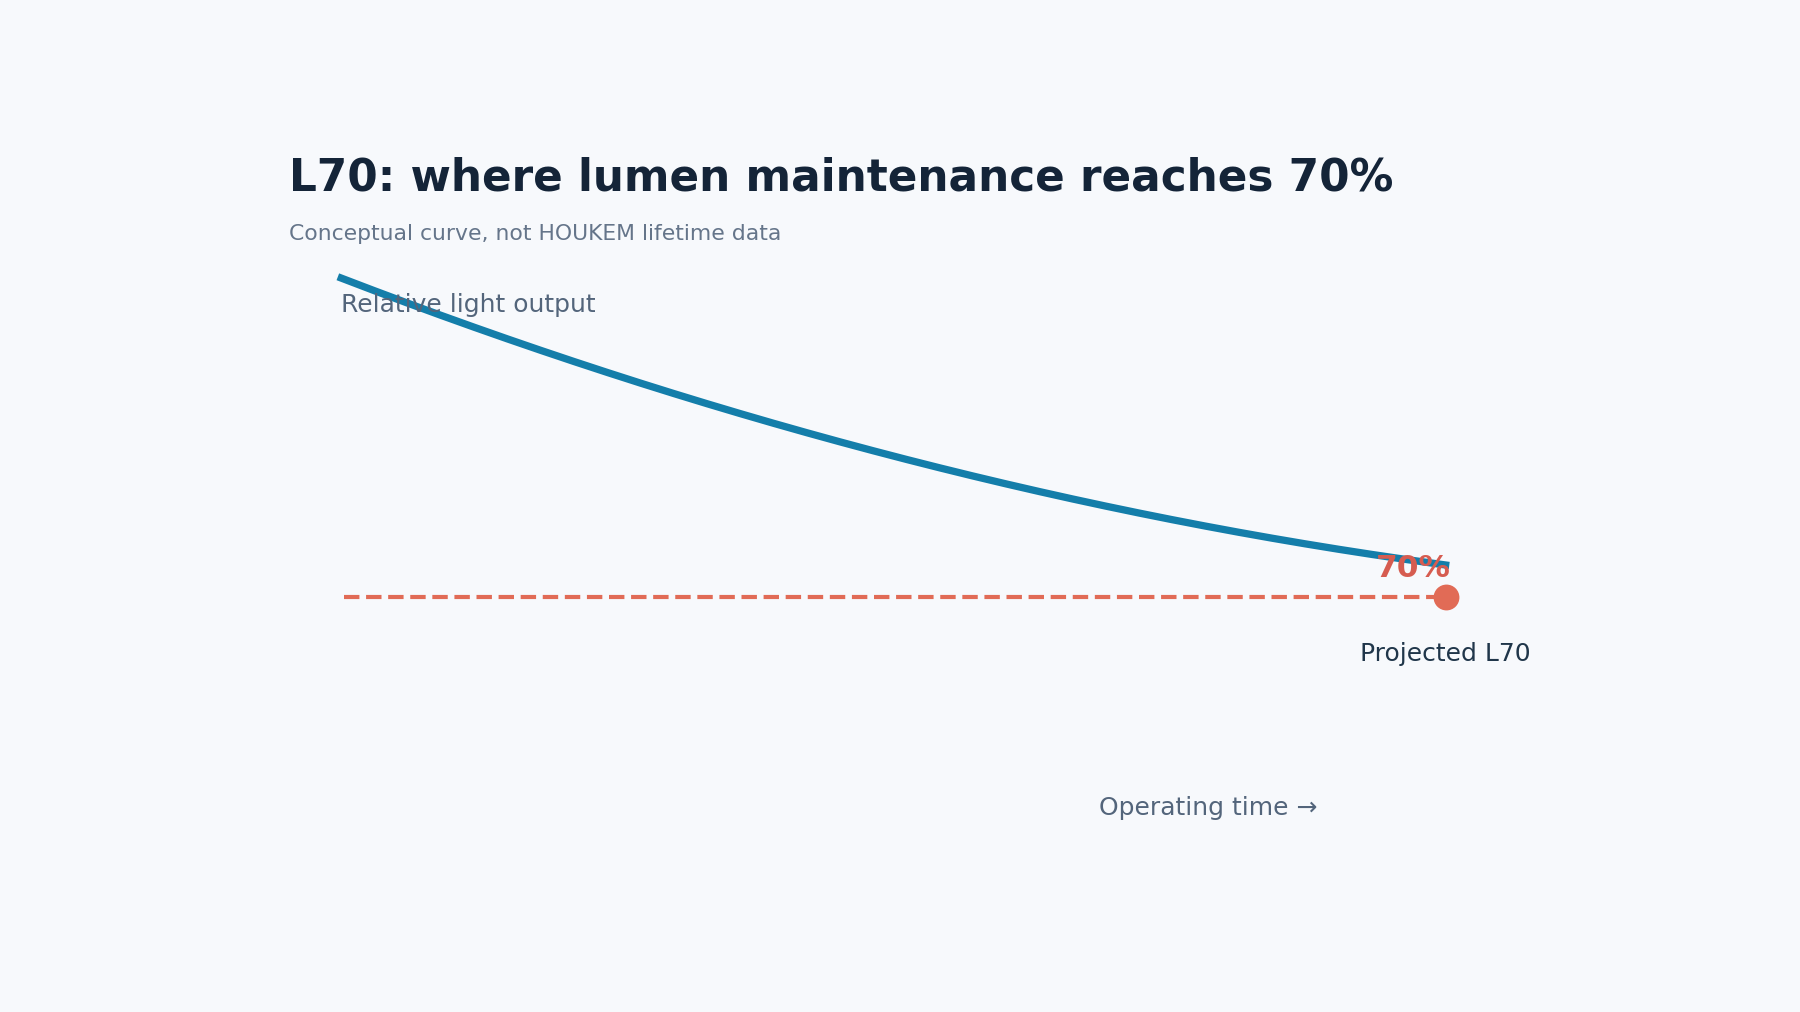
L70 is a threshold, not a failure. It marks the moment when the light output has declined to seventy percent of the value measured at the start of life, and it says nothing about whether the component has stopped working.
Because the threshold is defined by decline rather than by breakage, the number is only meaningful together with the conditions under which it was reached. A figure quoted without a drive current and a temperature is not a specification, it is a marketing number.
Most datasheets also state which measurement standard the projection follows. The standard defines the test duration, how the data are extrapolated and how far beyond the measured period the projection is allowed to extend, so it is part of the figure rather than a footnote.
How the Figure Is Produced
Manufacturers run a sample set at elevated conditions, measure light output at intervals, and fit a curve to the resulting decline. The fitted curve is then extrapolated to the seventy percent threshold, and the projected hours become the headline figure.
The critical detail is that the test conditions rarely match the application. Drive current, junction temperature and even the mounting arrangement of the test board all affect how quickly output declines, so the projection has to be adjusted before it describes a real design.
| Reported figure | Condition it assumes | Action if the design differs |
|---|---|---|
| Projected L70 hours | Specific drive current | Derate for the higher operating current |
| Projected L70 hours | Specific case temperature | Recalculate with the real thermal path |
| Test duration | Fixed ageing period | Treat longer projections as extrapolation |
| Measurement interval | Defined sampling plan | Check the slope, not only the endpoint |
Reading the curve rather than the endpoint is the single most useful habit here. A curve that is still falling steeply at the end of the test supports a far less confident projection than one that has already flattened, even when both report the same threshold.
Governing Parameters: Temperature, Current and Time
Junction temperature is the strongest influence on how quickly light output declines. That makes the thermal path a lifetime parameter rather than a separate thermal concern.
The path runs from the die through the package, the solder joint, the board and the heat sink to ambient. Every element adds resistance, and the calculation is the same one used in our guide to calculating LED junction temperature.
Drive current enters through the same door. Higher current raises the junction temperature for a given thermal path and also increases the stress on the die, so a design run at a higher current than the test condition should expect a shorter projected life.
The practical implication is that LED thermal design and lumen maintenance are the same conversation viewed from two directions. Our article on LED thermal management covers the hardware side of that path.
For a product team this turns the projected curve into a planning input rather than a datasheet footnote. LED reliability engineering and Reliability & Failure Analysis both use the projected decline to set a maintenance interval, and the panel-level view is covered in our note on LED display lifespan and reliability.
Trade-offs: Output, Cost and Lifetime
The most common trade-off is brightness against life. Driving a component harder raises output but shortens the projected maintenance interval, and the exchange rate depends on the individual package rather than on a general rule.
The second is cost against thermal margin. A larger heat sink or a thermally conductive board improves the projection, and the question is whether the improved interval matters for the product. For a consumer device replaced every few years the answer may be no; for an industrial fixture the answer is usually yes.
The third is confidence against ambition. A supplier can quote a longer projected life by extrapolating further beyond the measured period, and a buyer who does not ask for the test duration cannot tell the difference. Asking for the conditions is what turns a figure into a decision input.
Verification and Specification Checklist
Before accepting a lifetime claim, request the test conditions and the supporting curve, not only the projected hours. Confirm the drive current, the temperature and the standard that governs the projection.
Then compare those conditions with the design. If the product runs at a higher junction temperature, the projection needs to be adjusted before it appears in the specification, because a figure carried over unchanged is a figure that will not survive review.
Where the application is critical, check the failure mechanism analysis behind the projection. Ageing that follows a gradual decline behaves differently from a population with an early-failure tail, and our article on LED failure modes sets out the mechanisms that produce each shape.
Finally, state the expected operating condition in the specification, not just the projected hours. That single addition makes the figure reviewable and makes any later change of drive current visible as what it is, a change to the lifetime assumption.
Frequently Asked Questions
How to evaluate LED L70 lumen maintenance for an OEM design?
Request the test conditions alongside the projected figure and compare them with the real drive current and junction temperature. If the application runs hotter or harder than the test, adjust the projection before it enters the specification.
Which parameters matter most for LED L70 lumen maintenance?
Junction temperature and drive current matter most, because both accelerate the decline in light output. The thermal path between the die and ambient is what converts a drive setting into a junction temperature.
How does LED L70 lumen maintenance affect LED performance?
It determines how much light output remains after a given operating period, which sets the maintenance interval for the product. It does not describe sudden failure, so it should be read alongside a failure mode analysis rather than instead of one.
How should engineers validate LED L70 lumen maintenance before production?
Validate by confirming the test conditions match the design, then running a short ageing check at the real operating point to see whether the decline is consistent with the projection. Record the operating condition with the accepted life figure.
Is a longer projected L70 always better?
Not necessarily, because a longer projection may simply come from extrapolating further beyond the measured test period. The useful question is how much of the projection rests on measured data rather than on extrapolation.
Conclusion: Read the Conditions, Not Just the Hours
LED L70 lumen maintenance is a projection built from accelerated test data, and it only describes a real design when the drive current and thermal path match the test conditions. Treat junction temperature as a lifetime parameter and the number becomes a design input.
Ask for the conditions, compare them with the application, and record the operating point beside the accepted figure. If you need lifetime data interpreted for a specific drive current and thermal design, send your operating conditions to the HOUKEM team and we will confirm the applicable component scope.
LED Driver Compliance Voltage: Why Current Regulation Drops Out
LED FWHM Spectral Bandwidth: Reading the Width of an Emission Peak


